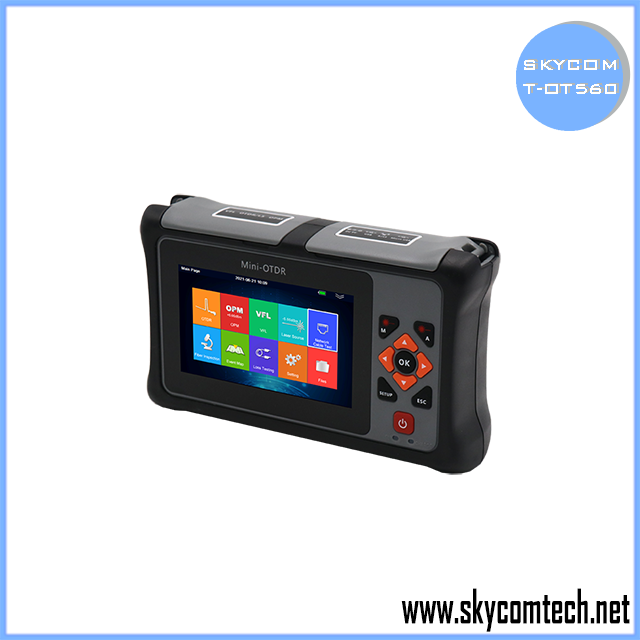
Modern network infrastructures demand absolute reliability and flawless data transmission. Achieving this rigorous standard requires far more than basic continuity checks. Fiber optic networks inevitably face physical degradation, hidden splice faults, and macrobends over time. These undetected issues severely degrade signal quality. An Optical Time Domain Reflectometer serves as a critical investment for minimizing network downtime and rigorously certifying fiber plant compliance. It transforms invisible fiber faults into clear, measurable data points.
We will quickly transition from basic concepts to advanced evaluation criteria. You will understand the operational realities and vital procurement considerations needed for modern deployments. Technical buyers and network managers face complex choices regarding dynamic ranges, dead zones, and wavelengths. This guide outlines how to navigate these essential specifications effectively. You will learn to overcome common measurement pitfalls and standardize testing procedures. Ultimately, we provide actionable frameworks to ensure accurate asset management across your optical network.
OTDR testing operates like a medical ultrasound for fiber, mapping distance, splice losses, and fault locations using backscattered light.
Purchasing decisions hinge on balancing Dynamic Range requirements (budgeting 5–8 dB above maximum link loss) against Event and Attenuation Dead Zones.
True testing accuracy requires bidirectional averaging to eliminate phantom gains ("gainers") and compliance with standard data formats (Telcordia SR-4731) for asset management.
Live network testing requires specific out-of-band wavelengths (e.g., 1625nm or 1650nm) and integrated filtering to prevent equipment damage.
Understanding the fundamental physics behind these devices ensures better field diagnostics. The core mechanism relies on the "Time of Flight" principle. The unit injects high-power laser pulses directly into the fiber core. It then calculates distances based on the precise return time of reflected light. The internal clock measures the microsecond delays of these returning photons. It converts this time delay into an exact distance measurement.
You can compare this process to medical ultrasound or aviation radar. An ultrasound reads acoustic echoes to visualize internal bodily structures. Similarly, this equipment reads light echoes to visualize internal cable integrity. It maps out a virtual cross-section of the entire fiber link. Technicians read this map to identify exactly where signal loss occurs.
The device analyzes two distinct types of returning light phenomena:
Rayleigh Backscattering: This represents continuous, low-level scattering. Microscopic impurities within the glass core cause this effect. The instrument uses Rayleigh backscattering to measure ongoing signal attenuation over long distances.
Fresnel Reflection: These appear as sharp, high-intensity reflections. They occur due to abrupt changes in the index of refraction. Common causes include glass-to-air transitions at connectors, mechanical splices, or physical fiber breaks.
While an OTDR excels at fault location, we must acknowledge a critical trustworthiness note. These devices rely on indirect measurement techniques. They should complement, rather than replace, an Optical Loss Test Set (OLTS). An OLTS performs direct, highly precise measurements of total insertion loss. Best practices dictate using both tools for complete tier-2 fiber certification.
Evaluating new test equipment requires a deep understanding of core specifications. You must align these technical parameters with your specific network architecture. Long-haul networks require vastly different capabilities than dense data centers.
Dynamic range defines the maximum observable length of a fiber link. We calculate it as the decibel difference between the initial backscatter level and the instrument's noise floor. A higher dynamic range pushes laser pulses further through the glass.
Technical buyers should follow a strict evaluation rule of thumb. Always select a dynamic range 5 to 8 dB higher than your maximum expected link loss. This optical budget buffer guarantees a clean signal-to-noise ratio at the far end of the cable. Without this buffer, distant fault events vanish into the background noise.
Dead zones represent blind spots along the fiber link. We use a "nighttime driving blinding" analogy to explain this phenomenon. When oncoming headlights flash your eyes, you temporarily lose vision. Similarly, high-reflection events temporarily overwhelm the sensitive photodetector inside the tester. The system cannot detect subtle faults until the detector recovers.
You must evaluate two distinct types of dead zones:
Event Dead Zone (EDZ): This measures the minimum distance required to distinguish two separate reflective events. Data centers rely heavily on excellent EDZ specifications. Technicians must distinguish between closely spaced patch cords in dense server racks.
Attenuation Dead Zone (ADZ): This dictates the minimum distance required to accurately measure a non-reflective event following a reflection. A short ADZ allows you to measure fusion splice losses immediately after a highly reflective connector.
Standard network testing uses specific wavelengths depending on the fiber type. Single-mode applications typically operate at 1310nm and 1550nm. Multimode installations use 850nm and 1300nm.
Live network scenarios introduce severe complications. Active Passive Optical Networks (PON) carry live traffic. If you test these active lines using standard wavelengths, you risk blinding or burning out your receiver. Live testing strictly requires out-of-band wavelengths, specifically 1625nm or 1650nm. Furthermore, your device must feature built-in active filters. These filters block incoming active traffic while permitting the test signal to pass safely.
Manufacturers design testing hardware in various form factors to suit different operational environments. Selecting the wrong form factor frustrates technicians and wastes capital. You must align the physical design with your daily deployment reality.
Benchtop units deliver uncompromising precision. Engineers design these feature-rich devices for laboratory qualification and manufacturing environments. They offer massive screens, extensive module bays, and the highest available dynamic ranges. However, they lack portability. They require AC power and careful handling. We rarely deploy benchtop units into the field.
Field technicians overwhelmingly prefer handheld or modular designs. These ruggedized, battery-operated units withstand harsh outdoor environments. They survive drops, dust, and extreme temperatures. Modern handheld devices frequently integrate secondary testing tools. You often find built-in Visual Fault Locators (VFL) and Optical Power Meters (OPM). This consolidation allows technicians to carry one tool instead of three. Modular designs offer exceptional flexibility. You can swap optical modules as your network evolves.
Enterprise networks and telecommunications providers deploy rack-mounted Remote Test Units directly into central offices. These embedded systems provide continuous, automated fault monitoring. An RTU constantly scans active fiber lines. It alerts administrators the moment a cable degrades or breaks. This proactive approach enables true predictive maintenance and drastically reduces repair times.
Form Factor | Primary Environment | Key Advantages | Ideal Application |
|---|---|---|---|
Benchtop | Laboratory / Manufacturing | Maximum precision, supreme dynamic range | Cable qualification, R&D testing |
Handheld | Field Operations / Outside Plant | Ruggedized, battery-powered, multi-tool | Daily troubleshooting, field splicing |
Rack-Mounted (RTU) | Central Office / Data Center | Automated, continuous scanning, integrated alarms | Predictive maintenance, network monitoring |
Even premium equipment produces confusing results if operators misunderstand fiber physics. Inexperienced technicians frequently misinterpret trace data. This leads to wasted repair efforts and misdiagnosed network segments. You must recognize and resolve these common measurement pitfalls.
Trace data sometimes shows a splice generating a surge of optical power. We call this impossible anomaly a "gainer." Fiber splices cannot amplify light. This phenomenon occurs when you splice a low-attenuation fiber to a high-attenuation fiber. The differing backscatter coefficients trick the detector. The second fiber naturally scatters more light back to the source. The instrument misinterprets this increased backscatter as an artificial power gain.
The Solution: You cannot fix this via software settings alone. You must mandate bidirectional testing. Technicians shoot the fiber from Point A to Point B, and then from Point B to Point A. Specialized software averages these two directional traces. This mathematical averaging completely eliminates phantom gains and reveals the true physical splice loss.
Highly reflective short links cause severe trace distortions known as ghosts. Light bounces back and forth between two highly reflective connectors. The instrument records these secondary echoes as equidistant "fake" events on the trace. Ghosts look like real physical events but show no actual insertion loss drop.
The Solution: Operators must identify ghosts by noting their equal spacing and lack of attenuation loss. To eliminate them physically, we advise using index-matching fluid at the launch connector. Alternatively, you can utilize specialized pulse-width adjustments to alter how the echoes register. Reducing the reflection at the source remains the best preventative measure.
Technicians constantly battle the physical limitations of pulse width parameters. Longer pulses push more optical energy into the glass. This improves dynamic range and lets you see further. However, longer pulses physically stretch out the light packet. This dramatically widens your dead zones and lowers spatial resolution.
Short pulses deliver pinpoint spatial resolution. They excel at mapping dense connector panels. Unfortunately, short pulses lack the energy to push through long distances. They quickly disappear into the noise floor. When facing noisy trace data, do not immediately increase the pulse width. Emphasize increasing your averaging time first. Longer averaging times reduce background noise mathematically without sacrificing your spatial resolution.
Inconsistent testing procedures yield inconsistent data. Field teams often waste hours chasing faults because they skipped fundamental preparation steps. Standardizing your approach guarantees vendor-neutral documentation and protects your expensive hardware from contamination.
Contaminated end-faces remain the leading cause of false test readings. A single microscopic dust particle creates massive reflectance. This reflectance blind-spots the detector immediately. Worse still, inserting a dirty connector into your test equipment transfers the dirt to the instrument's launch port. This physically damages the delicate internal photodiode.
You must strictly enforce an "Inspect Before You Connect" policy. Technicians must use a digital inspection probe on every single connector. If they spot debris, they must clean it using specialized lint-free tools and inspect it again. Only pristine glass touches the instrument port.
Connecting a tester directly to the network panel guarantees inaccurate results. The initial laser burst creates an immediate dead zone. You cannot measure the loss of the very first connector if the machine is currently blinded.
Dummy fiber rings, also called pulse suppressors, solve this physical limitation. They act as sacrificial buffer zones. You attach a launch cable between the instrument and the first panel. You attach a receive cable at the far end of the link. The launch cable absorbs the initial dead zone impact. The receive cable provides a backscatter reference past the final connector. This arrangement allows the software to accurately measure the true loss of the first and last connectors in your network.
Proprietary data formats lock you into specific hardware ecosystems. If you buy a different brand next year, you might lose access to historical trace files. Centralized asset management demands universal compatibility.
Highlight the importance of the Telcordia SR-4731 standard data format. These files use the .SOR extension. Ensure your procurement guidelines mandate .SOR file generation. This standard format ensures your testing records remain completely vendor-neutral. You can seamlessly integrate these files into centralized network management systems. Historical baseline comparisons become effortless, regardless of which manufacturer built your newest field tester.
Navigating optical fiber diagnostics requires strict adherence to physical limitations and best practices. Choosing the right testing equipment means aligning your dynamic range and dead zone specifications with the physical realities of your network architecture. A dense local area network demands minimal dead zones, while a cross-country long-haul link requires maximum dynamic reach.
Technical evaluators must look beyond raw power. Prioritize hardware modularity to future-proof your investment. Demand automated trace interpretation software to reduce training burdens on junior technicians. Above all, enforce standardized data reporting using the Telcordia SR-4731 format.
Take action by reviewing your current optical optical power budgets. Implement the 5–8 dB buffer rule for your next procurement cycle. Mandate bidirectional averaging for all critical splice certifications. By standardizing these procedures, you drastically reduce network downtime and establish an authoritative baseline for future maintenance.
A: No. These instruments perform indirect measurements using backscattered light and mathematical algorithms. While excellent for locating specific faults and splices, they only estimate total end-to-end loss. For highly accurate, direct measurement of total insertion loss, you must use an Optical Loss Test Set (OLTS).
A: Testing an active fiber with standard wavelengths causes optical collisions. Live traffic wavelengths overlap with your test pulses. This blinds the detector or causes total measurement failure. Additionally, thermal drift from active lasers can widen their spectrum, interfering with test signals. Always use out-of-band wavelengths (1625/1650nm) with filtered ports for live lines.
A: An Event Dead Zone (EDZ) is the minimum distance needed merely to detect two separate reflective events. It relies on a smaller optical drop. An Attenuation Dead Zone (ADZ) is longer. It represents the distance required for the detector to fully recover and accurately measure the non-reflective loss following an event.
A: You should generally calibrate your equipment annually. Most manufacturers explicitly recommend a one-year calibration cycle to ensure laser accuracy and detector sensitivity. Adhering to this annual schedule ensures your test results comply with ISO quality standards and prevents hidden measurement drifts.